

The Main Problem
The biggest problem in large retail industries that have many customers is the difficulty of knowing which customers are loyal.
This is why.
- There are many customers, each of whom (obviously) behaves differently.
- There are many types of goods, which causes customer behavior towards each type of goods to be different.
Therefore, this case becomes complex.
How we solve this case? First, we define a measure of customer loyalty. Loyal is a customer who buys regularly according to their behavior; with constant recency and quantity of order. Then we calculate the behavior probability of future purchases using a statistical model.
Notes:
Recency: the time difference between the last transaction and today
How Do We Solve?
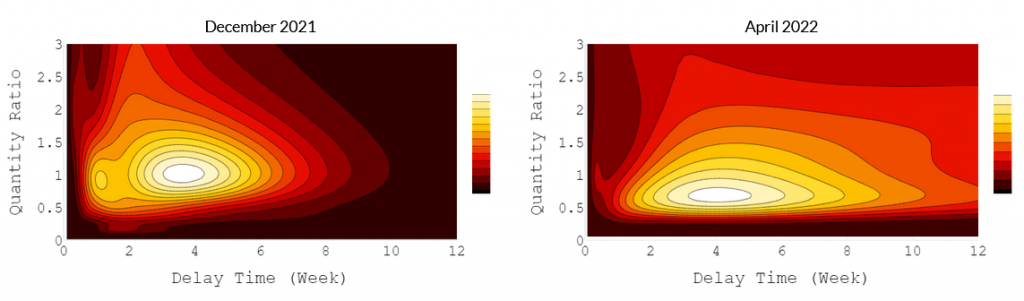
We visualize the results of the probability using a heat map. Let’s take a look at the visualization results for Customer A in December 2021 and April 2022. The lighter the color, the greater the probability value.
Let’s Us Analyze Customer A
The x-axis shows recency in weeks, and the y-axis shows the quantity ratio. If the quantity ratio > 1, the purchase quantity increases and vice versa if < 1, the purchase quantity decreases.
Based on the December visualization, we can perform an analysis that Customer A most often repurchases once every 3-4 weeks and sometimes once a week. In terms of the quantity ratio, we see that it is close to 1, so it can be concluded that the quantity of purchases is constant as is its historical behavior. Besides that, we can see recency > 12 weeks which has very little chance. This means that it can be said it is impossible for Customer A to repurchase every 12 weeks.
Then we see the visualization of Customer A 5 months later. We see a shift in recency, which is currently 3.5-5 weeks. It is also unlikely that Customer A will repurchase once a week. In terms of quantity, we see a decrease in the ratio to 0.75. This means that there is a decrease in the quantity of goods ordered. The chance to be repurchased once every 12 weeks looks bigger than in December.
Your Team Have an Early Warning System
From this example, we see a change in behavior from Customer A, which also shows a decrease in loyalty.
This analysis functions as an Early Monitoring System. Through this analysis, the team can immediately have information about customers whose loyalty is decreasing and take action to avoid churn.
Let’s start to understand your customer better with us!

